Getting Started
Getting Started
Installation
Installation
Inspect Traffic
Inspect Traffic
HTTP Rules (Modify Traffic)
HTTP Rules (Modify Traffic)
Overview
Request Modification — Redirect URL (Map Local, Map Remote)
Request Modification — Replace Strings (Switch Hosts, API Endpoints)
Request Modification — Modify Headers
Request Modification — Modify Request Body
Response Modification — Modify Response Body
Request Modification — Modify Query Params
Request Modification — Modify User Agents
Request Modification — Delay Request
Request Modification — Map Local
Request Modification — Map Remote
Response Modification — Modify DOM/Inject scripts
Response Modification — Cancel Rule
Predefined Functions
Organizing Rule — Grouping
Organizing Rule — Import/Export Rules from File
Organizing Rule — Pause/Resume Requestly
Organizing Rule — Rule Operators
Organizing Rule — Advance Targeting
Organizing Rule — Sharing Rules
Organizing Rule — Pinning Rules
GraphQL - Modify Request & Response
Import / Export — Charles Proxy Rules
Test Rules — Test URL Condition
Test Rules — Test this Rule
Session Book
Session Book
File Server
File Server
Public API
Public API
Guides
Guides
TroubleShooting
TroubleShooting
Subscription & Billing
Subscription & Billing
Getting Started
Getting Started
Installation
Installation
Inspect Traffic
Inspect Traffic
HTTP Rules (Modify Traffic)
HTTP Rules (Modify Traffic)
Overview
Request Modification — Redirect URL (Map Local, Map Remote)
Request Modification — Replace Strings (Switch Hosts, API Endpoints)
Request Modification — Modify Headers
Request Modification — Modify Request Body
Response Modification — Modify Response Body
Request Modification — Modify Query Params
Response Modification — Modify DOM/Inject scripts
Request Modification — Modify User Agents
Request Modification — Delay Request
Response Modification — Cancel Rule
Organizing Rule — Grouping
Organizing Rule — Import/Export Rules from File
Organizing Rule — Pause/Resume Requestly
Organizing Rule — Rule Operators
Organizing Rule — Advance Targeting
Organizing Rule — Sharing Rules
Request Modification — Map Local
Request Modification — Map Remote
Organizing Rule — Pinning Rules
GraphQL - Modify Request & Response
Import / Export — Charles Proxy Rules
Test Rules — Test URL Condition
Predefined Functions
Test Rules — Test this Rule
File Server
File Server
Public API
Public API
Guides
Guides
Session Book
Session Book
Subscription & Billing
Subscription & Billing
Inspect Traffic
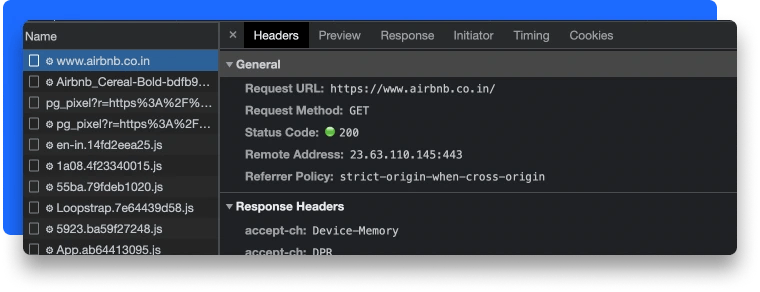
Inspecting network traffic from browser developer tools allow you to see the requests and responses between your browser and the web server.
You can see all the network requests initiated by the browser and the corresponding responses from the web server. Use this information to debug issues related to network requests, such as slow loading times, missing resources, or failed requests. This includes information such as:
- URL of the requested resource
- HTTP method (e.g. GET, POST, etc.) used for the request
- Request and response headers
- Request and response payloads
- HTTP status code of the response
👉 Using Desktop App
Here's how you can use
Network Traffic table to inspect network requests and responses in your app: - Open Requestly desktop app
- Click on
Connect appsbutton as shown below
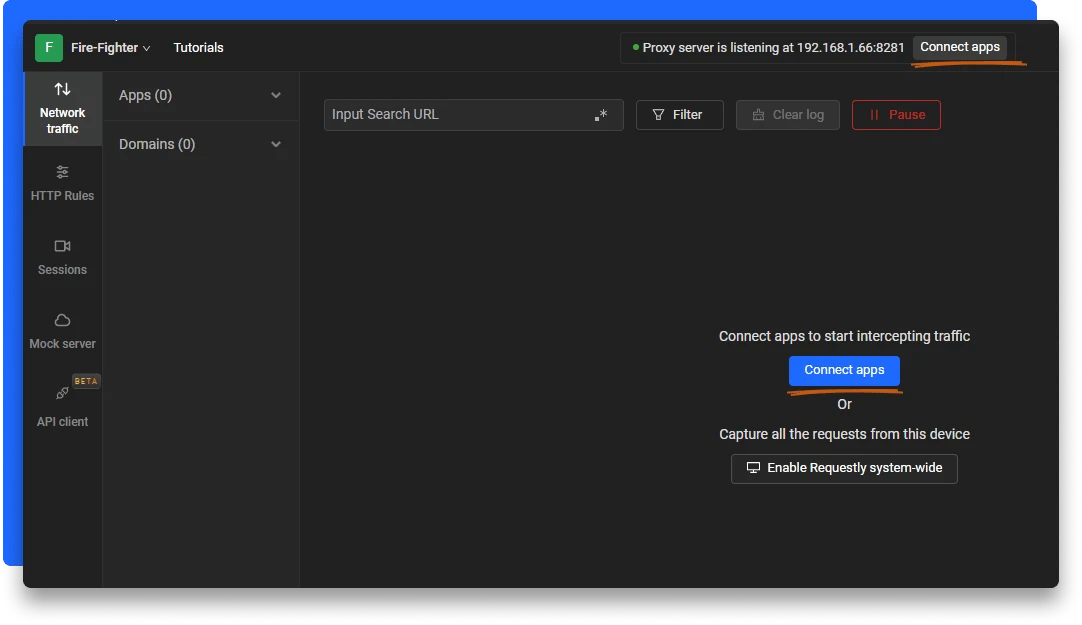
- Select your preferred system app.

For example, lets open a new Chrome browser instance.
- Your network traffic table will now get populated with network requests and responses as you visit any page on your selected system app.
👉 Using Browser Extension
Following the below steps to inspect network traffic in developer tools of your browser.
- Go to the page whose network traffic you want to inspect.
- Press
F12orCmd+Shift+C/Ctrl+Shift+Cto open the developer tools.
NOTE
Set up a shortcut in the Settings to open the dev tools, or alternatively, it can be opened by right-clicking and selecting Inspect Element.
- Switch to the Network tab.

- Reload the page to see all the network requests and responses that occured on the page.
- Filter the list based on
Status Codes,URL, and the predefinedfiltersbased on the type of network request or response like: - Fetch/XHR
- JS
- CSS
- Img
- You can analyze the each network request details by inspecting the details such as the URL, HTTP method, request and response headers, response payload, timing information, and more.